|
Introduction
In this activity you will compare the length
of missions for four space shuttles over a
seven-year period. You will determine
statistical measures of central tendency,
including mean, median, and mode. You will also
create a box-and-whiskers plot. You will draw
the upper and lower quartiles and show the upper
and lower end points of the data on your graph.
These skills will be important during the
mission.
Vocabulary
box-and-whiskers plot: a method of
displaying data that helps in interpreting
how data is distributed on an interval
scale. A box-and-whiskers plot shows the
shape of the distribution, its central
value, and the variability. It especially
helps show whether a distribution is skewed
or whether there are unusual observations in
the dataset (outliers).
central tendency: how much the
values of a distribution cluster, usually
measured by mean, median, or mode.
lower quartile: the median of the
lower part of the data.
mean: the arithmetic average; the
sum of all the scores divided by the number
of the scores.
median: the middle of a set of
data. Half the scores are above the median;
half are below. To find the median:
- If the number of data is odd, the
median is in the center.
- If the number of data is even, the
median is the average of the two center
scores.
mode: the number or score that
appears most often in a set of data.
quartile: a division or group of
data that separates the data into equal
parts.
upper quartile: the median of the
upper part of data.
Materials
- Data Analysis worksheet
- Pencil
- Ruler
Procedure
- Be sure you understand all of the
vocabulary.
- Look at the Atlantis data example. Use
this example to guide you as you create a
box-and-whiskers plot for the other three
shuttles’ data.
- Analyze the mean, median, mode, and
box-and-whisker plot for each shuttle to
answer the questions.
Box-and-Whiskers Plotting and Statistical
Analysis Activity
The following table contains data from space
shuttle missions flown from 1996-2003.
|
STS |
Space Shuttle
Name |
Duration of
Mission
(days) |
| 80 |
Columbia |
17 |
| 81 |
Atlantis |
10 |
| 82 |
Discovery |
9 |
| 83 |
Columbia |
3 |
| 84 |
Atlantis |
9 |
| 85 |
Discovery |
11 |
| 86 |
Atlantis |
10 |
| 87 |
Columbia |
15 |
| 88 |
Endeavor |
8 |
| 89 |
Endeavor |
11 |
| 90 |
Columbia |
15 |
| 91 |
Discovery |
9 |
| 92 |
Discovery |
12 |
| 93 |
Columbia |
4 |
| 94 |
Columbia |
15 |
| 95 |
Discovery |
8 |
| 96 |
Discovery |
9 |
| 97 |
Endeavor |
10 |
| 98 |
Atlantis |
12 |
| 99 |
Endeavor |
11 |
| 100 |
Endeavor |
11 |
| 101 |
Atlantis |
9 |
| 102 |
Discovery |
12 |
| 103 |
Discovery |
7 |
| 104 |
Atlantis |
12 |
| 105 |
Discovery |
11 |
| 106 |
Atlantis |
11 |
| 107 |
Columbia |
15 |
| 108 |
Endeavor |
10 |
| 109 |
Columbia |
10 |
| 110 |
Atlantis |
10 |
| 111 |
Endeavor |
13 |
| 112 |
Atlantis |
10 |
| 113 |
Endeavor |
13 |
Tasks
- Construct box-and-whiskers plots for
each of the space shuttles and the durations
of its missions.
- Identify the mean, median, and mode for
each of the four sets of data.
- An example has been done using the
Atlantis data. Use this example as a model
to construct a box and whiskers plot and
identify the mean, median, and mode (central
tendencies) for the other shuttles.
Example: Atlantis
The following numbers represent the duration
of the missions carried on by the Atlantis:
10, 9, 10, 12, 9, 12, 11, 10, 10
Step 1: Calculate the Mean
Mean = (10+9+10+12+9+12+11+10+10)/9
Mean = 10.33
Step 2: Calculate the Median
There are nine numbers in the set of
data. The median is the one in the middle
when they are written in ascending numerical
order:
9, 9, 10, 10, 10, 10, 11, 12, 12
Median = 10
Step 3: Calculate the Mode
List how many times each number is
repeated:
|
Number |
Repetitions |
|
9 |
Two |
|
10 |
Four |
|
11 |
One |
|
12 |
Two |
Mode = 10
Step 4: Draw the Box-and-whiskers Plot
Find the lower quartile, the median, the
upper quartile, the smallest value, and the
largest value.
Smallest
↓ |
|
|
|
Median
↓ |
|
|
|
Largest
↓ |
|
9 |
9 |
10 |
10 |
10 |
10 |
11 |
12 |
12 |
| |
|
↑
Lower
quartile |
|
|
|
↑
Upper
quartile |
|
|
b) Graph those values in the worksheet.
Draw a box between the two quartiles.
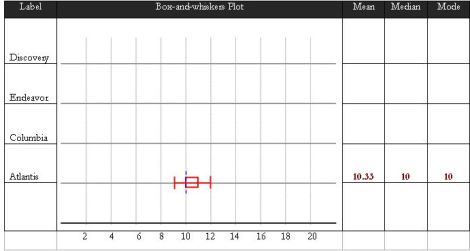
Data Analysis Worksheet
In the following worksheet construct
box-and-whiskers plots and identify the mean,
median, and mode for each of the shuttles.
Analysis Questions
Use your box-and-whiskers plots to answer
the following questions:
- Which shuttle flew the longest mission?
- Which shuttle flew the shortest mission?
- Which shuttle’s duration had the
smallest range? Explain.
- Which shuttle had a median of 11 days?
|