|
Introduction
Scientists use a
variety of
statistical tools in
order to interpret
and compare data.
These tools include
the three measures
of central tendency
(the mean, median,
and mode) and
box-and-whiskers
plots.
In this activity
students will
compare the duration
of missions for four
different U.S. space
shuttles over a
seven-year period.
The students will
learn that various
statistical tools
show different
characteristics
about a set of data.
Vocabulary
box-and-whiskers
plot: a method of
displaying data that
helps in
interpreting how
data is distributed
on an interval
scale. A
box-and-whiskers
plot shows the shape
of the distribution,
its central value,
and the variability.
It especially helps
show whether a
distribution is
skewed or whether
there are unusual
observations in the
dataset (outliers).
central tendency:
how much the values
of a distribution
cluster, usually
measured by mean,
median, or mode.
lower quartile:
the median of the
lower part of the
data.
mean: the
arithmetic average;
the sum of all the
scores divided by
the number of the
scores.
median: the
middle of a set of
data. Half the
scores are above the
median; half are
below. To find the
median:
-
If the number of
data is odd, the
median is in the
center.
-
If the number of
data is even,
the median is
the average of
the two center
scores.
mode: the number
or score that
appears most often
in a set of data.
quartile: a
division or group of
data that separates
the data into equal
parts.
upper quartile:
the median of the
upper part of data.
Math Standards
Grades 6-8: Data
Analysis and
Probability Standard
Select and use
appropriate
statistical methods
to analyze data.
-
Find, use, and
interpret
measures of
center and
spread,
including mean
and
interquartile
range.
-
Discuss and
understand the
correspondence
between data
sets and their
graphical
representations,
especially
histograms,
stem-and-leaf
plots, box
plots, and
scatterplots.
Materials
-
Copies of
Student
Worksheet:
Statistical
Measures
-
Pencil
-
Ruler
Procedure
-
Preview
the activity with
the students. Read
the student version
of the Introduction
and the Vocabulary
section aloud in
class. Allow time
for questions and
discussion.
-
Direct
your students to
work through the
Procedure, Analysis
Activity, and
Example sections of
the worksheet.
-
Students
should complete the
Data Analysis
section and answer
the analysis
questions.
-
Review
the answers to the
questions as a class
using the answer key
as your guide.
-
Make
sure that your
students understand
the relevance of
this activity to
their mission work.
During the FSI:
Tranquility Base
live simulation
students will use
box-and-whiskers
plots to make
important decisions.
Answer Key:
Data Analysis Worksheet
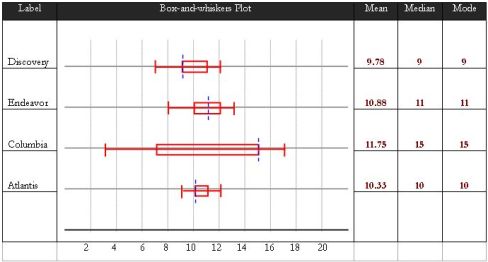
Analysis Questions
Use your box-and-whiskers plots to answer the
following questions:
-
Which shuttle flew the
longest mission?
The shuttle Columbia with a mission of 17
days.
-
Which shuttle flew the
shortest mission?
The shuttle Columbia with a mission that
lasted three days.
-
Which shuttle’s
duration had the smallest range? Explain.
The shuttle Atlantis with a range of 3
(The length of whiskers shows the range of
the numbers.)
-
Which shuttle had a
median of 11 days?
The shuttle Endeavor.
|