Skip to NavigationSkip to Content
Image that reads Storm-E Weather Simulation that links to the Storm-E home page.
Button that takes you to Students.Button that takes you to Teachers.Button that takes you to Weather Extra.Button that takes you to Links.Button that takes you to Images.
Image that reads Students.
Air Pressure  
Humidity  
Temperature  
Wind  

Picture Help

Home | Fast Facts | Picture Help | Maps and Graphs

Image of a graph which shows precipitation as it falls through different temperatures of the atmosphere.  Please have someone assist you with this.

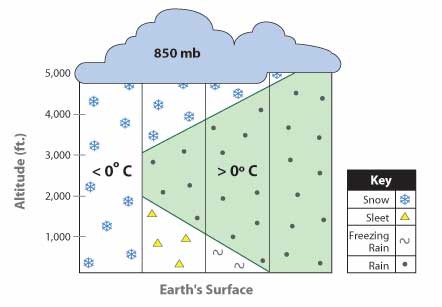
Precipitation may change form as it falls through
different temperatures of the atmosphere.


Page 1 | Page 2

Privacy Statement and Copyright © 1999-2004 by Wheeling Jesuit University/The NASA-sponsored Classroom of the Future program. All rights reserved.
Some images copyright © 2004 www.clipart.com.