|
Student Activity Sheet
Introduction
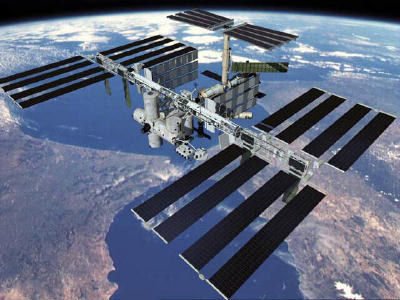
The International Space Stations (ISS) only source of power is sunlight. The ISS has many solar panels, arranged in arrays
that provide all the energy needed to perform vital maneuvers, complete scientific experiments, and maintain life support systems
for the crew. Each of the solar arrays is 112 ft. long by 39 ft. wide. The solar arrays are made up of photovoltaic cells. There
are quite a few types of solar cells that vary according to type of material used and materials added. The ISS solar cells are
made from purified silicon, which directly converts light to electricity. The large numbers of cells arranged in the panels and
arrays produce high power levels.
 A spacecraft orbiting Earth is not always in direct sunlight. As it revolves, it goes into Earths shadow and is out of direct
sunlight. The ISS then relies on nickel-hydrogen rechargeable batteries to provide the continuous amounts of power needed for
life support systems.
A spacecraft orbiting Earth is not always in direct sunlight. As it revolves, it goes into Earths shadow and is out of direct
sunlight. The ISS then relies on nickel-hydrogen rechargeable batteries to provide the continuous amounts of power needed for
life support systems.
Solar cells vary greatly in their efficiency. The most efficient cells are made from single giant crystals of silicon. Cheaper
cells are usually polycrystalline cells made up of masses of smaller silicon crystals. Cells also vary in their response to
different wavelengths of light. The broader the spectrum of light that hits it, the more electricity it produces. Scientists are
trying to increase the efficiency of solar cells to allow for production of greater amounts of electricity. The most efficient
cells now range from 10-20 percent.
Photovoltaic systems are set up to maximize the suns light by aligning the system at the most efficient angle with the sun. The
angle must change for the time of day and for the season.
Skills
You practice measurement, laboratory, and design skills and techniques through the construction of the PV cell apparatus and the
measurement of the voltage produced by manipulating the variable to be tested. You review the scientific method and practice graphing
the data to draw conclusions about the effects of wavelength and angle on voltage produced.
Objectives
You will:
- Use scientific methods to identify manipulated and responding variables in an experiment.
- Demonstrate skill in the measurement of small voltages using a voltmeter.
- Graph the quantitative data.
- Draw conclusions about the efficiency of PV cells and the color of wavelength.
- Draw conclusions about the efficiency of PV cells and the angle of the cell to the light source.
- Relate the PV experiment to your Space Station Alpha mission and realize the importance of solar energy to ISS functions.
Activity Overview
In this experiment you construct a simple photovoltaic system using a PV cell and a voltmeter to learn how the wavelength of light
affects the amount of electricity produced from the cell. You also experiment to find out how the solar cell angle to the light source
affects energy produced.
Key Questions
- How does a solar cell work?
- How does the color of light hitting a solar cell affect its efficiency?
- How does the angle of the cell to the light source affect energy production?
- How can you measure the efficiency of a solar cell?
Key Concepts
- The space station needs a constant source of power in order for the astronauts to stay alive and for the scientific work
of the station to continue.
- The source of power for the station is energy from the sun.
- Photovoltaic cells convert the suns energy into electricity.
Materials and Preparation
- Voltmeter or ammeter
- PV cell (with attached leads)
- Several sheets of colored cellophane sheets (as many colors as you want to test, but minimally use a clear sheet, a red
sheet, and a blue sheet.)
- Protractor
Vocabulary
- ammeter: instrument for measuring electric current (in amps).
- array: solar panels wired together to work together to produce greater amounts of
electricity.
- electricity: a flow of electrons over a wire.
- electrons: the negatively charged particles of an atom.
- photovoltaic cell (PV cell): (comes from photo, meaning light, and voltaic,
meaning producing electricity) converts sunlight into electricity; made from at least two layers of semiconductor material,
such as silicon.
- voltmeter: an instrument that measures voltage, or the potential difference between
two points in a circuit.
- wavelengths: the distance between two points of a light wave.
Procedure
Part A
- Construct your photovoltaic system:
- Attach the red wire from the PV cell to the red lead of the voltmeter. If your PV wires do not already have an
alligator clip attached, you can just wrap the two wires together.)
- Attach the black wires for the PV cell to the black lead wires of the voltmeter.
- Be sure that your voltmeter is set to measure direct current. Set the meter to its lowest range to be sure that
you are recording your lowest currents produced.
- Use the sun, or shine a light source on the PV cell and check to see if you are getting a reading. If you do not get a
reading, check the wire connections.
- Keeping the sunlight (or light source) constant, cover the PV cell with a piece of colored cellophane. Record the number
of volts on your data table.
- Repeat the procedure using all the colors of cellophane, including the clear cellophane. Why are you using a clear piece
of cellophane? (Hint: Think about the parts of a scientific experiment.)
- Take a magnifying glass and concentrate the light on the PV cell. Measure the new current produced and record it in your
data table.
- Take a piece of aluminum foil and design a light reflector for your PV cell to concentrate the light shining on it. Measure
the new current with the reflector attached and record in your data table.
- Graph your data. Be careful to label each axis.
- Answer the questions in the Reflection section of this lab.
Part B
- Place the PV cell directly pointing to the sun (or light source) at a 90-degree angle.
- Record the number of volts in your data table.
- Using a protractor, slant the PV cell 15 degrees away from the direct position and record the volts generated.
- Repeat the procedure, changing the angle another 15 degrees each time and recording the volts.
- Graph your data.
- Answer the questions in the Reflection section of this lab.
Reflection and Discussion
- Which color produced the greatest voltage? Why?
- Which color produced the smallest voltage? Why?
- Why did you use the clear cellophane?
- How would you answer someone who asked you what time of day would produce the most electricity from a PV cell?
- How would you increase the output of a PV cell during the day, when the angle of the suns rays is constantly changing?
- Why do you think that more electricity from solar power could be produced in the winter in northern latitudes even though
the Earth is farther away from the sun?
|